Princeton Acceptance Rate and Admission Stats
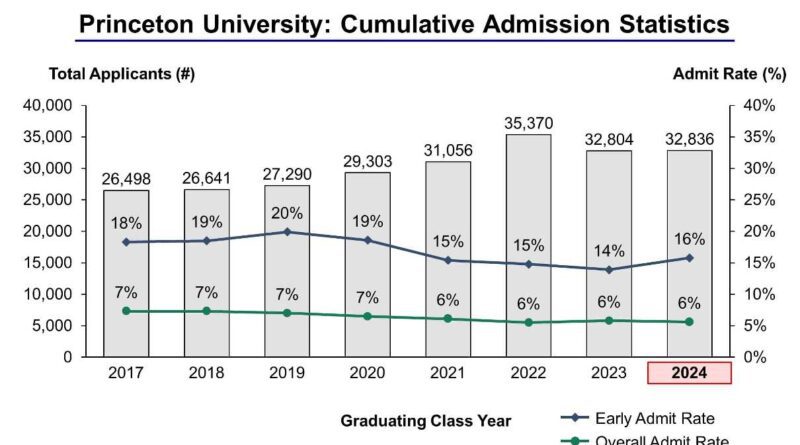
Princeton University is an extremely competitive institution and very tough one to get admissions into. Princeton Acceptance Rate is 6% for Regular admissions and 15% for Early Action admissions. This is because fewer and top students apply for early action admissions. The decision date for both of the admission is May 01. Princeton’s Average GPA of the admitted students is 3.95. It means that you need straight A’s in all your classes and have taken AP or IB courses.
Princeton’s average SAT Math score is 780-800. And average ACT Score is 34-35. Hence by means, only the top students get admitted to Princeton. Following is an statistical analysis of Princeton Admissions.
Princeton Acceptance Rate
| Year | Number of Applicants | Acceptance Rate | Early admit Rate |
| 2017 | 26,498 | 7% | 18% |
| 2018 | 26,641 | 7% | 19% |
| 2019 | 27,290 | 7% | 20% |
| 2020 | 29,303 | 7% | 19% |
| 2021 | 31,056 | 6% | 15% |
| 2022 | 35,370 | 6% | 15% |
| 2023 | 32,804 | 6% | 14% |
| 2024 – Expected | 32,836 | 6% | 16% |
Princeton Admission Calendar
Princeton offers Single Choice Early action admissions. Single Choice Early Action Admissions means that you can apply early only to Princeton and not any other university or school.
Princeton also offers Regular Decision. Both programs have a candidate’s reply date of May 1.
The University also offers a transfer admission process that enrolls a group of exceptionally well-prepared transfer students.
Princeton Application Deadlines
| Single-Choice Early Action | Nov. 1 |
| Regular Decision | Jan. 1 |
| Transfer | March 1 |
Princeton Admission 2023: Class of 2027
As of August 21, 2023; all percentages rounded
| Applicants | Number | % of total |
| Total | 39,644 | — |
| Men | 19,541 | 49.3 |
| Women | 20,103 | 50.7 |
| International students | 9,402 | 23.7 |
| Admitted | Number | % of total |
| Total | 1,782 | — |
| Men | 870 | 48.8 |
| Women | 912 | 51.2 |
| International students | 226 | 12.7 |
| Enrolled, first year, first time | Number | % of total |
| Total | 1,366 | — |
| Men | 670 | 49.1 |
| Women | 696 | 50.9 |
| International students | 185 | 13.5 |
Princeton Statistics for Enrolled Class of 2027
Total enrolled: 1,366
- 51% of students in the class are female and 49% are male.
- 17% of students in the class are the first in their families to go to college.
- 66% of students in the class qualify for financial aid.
- 22% of students in the class are eligible for need-based Federal Pell Grants.
Princeton Middle 50% SAT Scores
- Math 780-800
- Evidenced-based Reading and Writing: 760-780
Princeton Middle 50% ACT Scores
- Composite score: 34-35
First-Year Application Checklist
Submit
- A Completed Application. You must submit your application online through the Coalition Application or Common Application. Princeton’s CEEB Code: 2672
- Princeton-specific Questions. In addition to the questions provided by the Coalition Application or Common Application, all applicants must submit the Princeton-specific Questions. You should submit the Princeton-specific Questions online through the Coalition Application or Common Application website.
- Application Fee or Fee Waiver. You may submit a fee waiver one of two ways: 1) Select the fee waiver option on the Coalition Application or Common Application. Your school counselor must approve your fee waiver request online or submit your fee waiver form by mail or fax. 2) Select one of the following fee waiver options on the application: Princeton-specific, ACT, College Board or NACAC. All low-income students are eligible for the Princeton-specific fee waiver. In addition, all applicants who are serving or have served in the U.S. military are eligible for the Princeton-specific fee waiver. If you use the Princeton-specific fee waiver, you do not need to get approval from your college counselor or academic adviser.
- Graded Written Paper. A graded written paper is required, preferably in the subjects of English or history.


