
U.S. College Enrollment and Acceptance Rate Trends (2012-2024)
Acceptance rate measures the percentage of applicants admitted to a college or university. It is often seen as a direct indicator of competitiveness: the lower the acceptance rate, the tougher it is to get in. Many students and parents believe it has never been harder to gain admission to college. However, official data from the National Center for Education Statistics (NCES) and the Integrated Postsecondary Education Data System (IPEDS) paints a different picture.
Enrollment is Declining Despite More Opportunities
Over the past decade, U.S. college enrollment has steadily declined. Federal data shows that undergraduate enrollment fell by more than 2 million students in the last ten years—a drop of over 10 percent. In Fall 2024, there were about 19.28 million undergraduates, down roughly 8.4 percent from the 2010 peak. Rising tuition costs, alternative career pathways, and shifting perceptions of the value of a degree all contribute to this decline.
Acceptance Rates Are Rising
Contrary to public perception, admission is not getting universally tougher. Research from the American Enterprise Institute found that the median acceptance rate at bachelor’s-granting institutions rose by 7.6 percentage points compared to a decade earlier. These figures exclude “open admission” colleges that admit 100 percent of applicants, but they highlight an important trend: many schools are becoming less selective.
According to data reported to NCES, in 2012 only 80 percent of nonprofit colleges had acceptance rates above 50 percent. By recent counts, that number has climbed to 87 percent.
Public vs. Private Institutions Acceptance Rate
Separate findings from the National Association for College Admission Counseling (NACAC) confirm the trend. Today, about 78 percent of first-year applicants to public universities are admitted, while 70 percent of applicants to private colleges receive offers. Back in 2014, these numbers were lower: 68 percent for public institutions and 65 percent for private institutions.
The Exception: Elite Universities
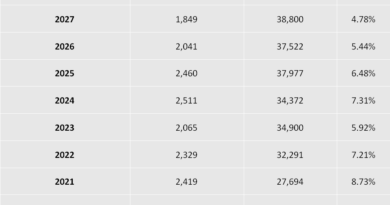
The perception that admissions are getting tougher largely comes from a small group of elite universities. For instance, Brown University admitted only 5 percent of applicants in 2022, down from 17 percent in 2002. In total, just 33 universities in the United States have acceptance rates below 10 percent. These highly selective institutions dominate headlines, creating the impression that competition is fiercer everywhere.
At the majority of colleges, however, the opposite is true: students today have a higher chance of being admitted compared to their peers a decade ago.
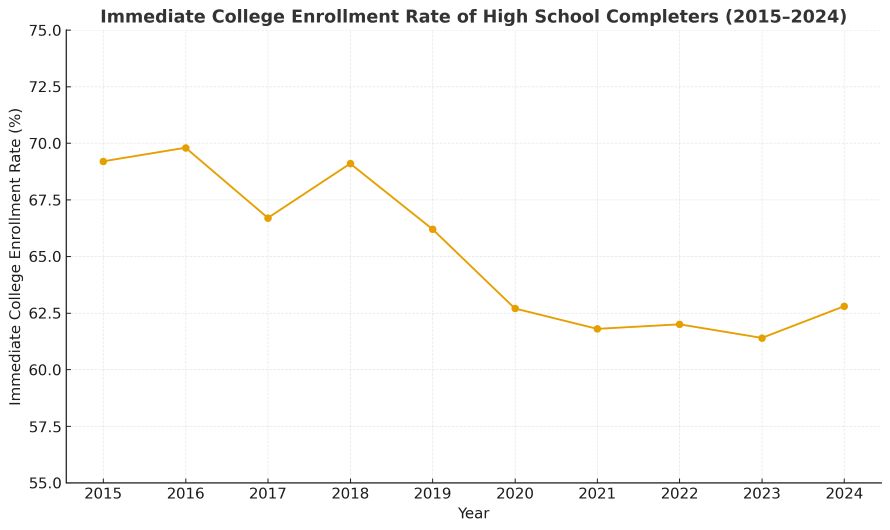
Fewer High School Graduates Going to College
The trend is reinforced by declining demand. In 2015, 70 percent of U.S. high school graduates enrolled in college immediately after graduation. By 2022, the rate had dropped to 62 percent, and in October 2024, the figure stood at 62.8 percent. (NCES data here) This shrinking pipeline of high school graduates directly affects college application numbers and acceptance rates.
| Year | Immediate College Enrollment Rate % |
| 2015 | 69.2 |
| 2016 | 69.8 |
| 2017 | 66.7 |
| 2018 | 69.1 |
| 2019 | 66.2 |
| 2020 | 62.7 |
| 2021 | 61.8 |
| 2022 | 62 |
| 2023 | 61.4 |
| 2024 | 62.8 |
Check acceptance rates of all U.S. Colleges State wise
A Mixed Picture of Student Quality
Some institutions report that the academic credentials of admitted students—such as SAT/ACT scores and GPA—have risen. But these cases remain limited to a handful of selective universities. For most institutions, the story is clear: admission is more accessible, not more competitive.
The Real State of College Admissions
The U.S. higher education system is at a crossroads. While elite schools continue to drive media attention with historically low acceptance rates, the majority of colleges are more open than ever. At the same time, declining enrollment, demographic shifts, and changing student priorities raise questions about the long-term sustainability of many institutions.
For students and families, the data offers reassurance: except for a few highly selective universities, getting into college is easier today than it was a decade ago. For policymakers and educators, however, the numbers signal a challenge—ensuring that higher education remains attractive, affordable, and relevant in an era when fewer students are choosing to enroll.
The reality is clear: admissions are not universally getting tougher, but the future of U.S. higher education depends on how institutions respond to declining demand and shifting expectations.
U.S. College Enrollment & Acceptance FAQs (2015–2024)
Enrollment has been steadily dropping for more than a decade. According to NCES, undergraduate enrollment in Fall 2024 stood at 19.28 million, down nearly 8.4% from the 2010 peak. Rising tuition costs, student debt concerns, alternative career pathways, and demographic shifts (fewer high school graduates in some regions) are the main drivers.
In 2015, about 70% of U.S. high school graduates went directly to college. By 2024, that figure had dropped to 62.8% (NCES data). This means more students are either delaying college, entering the workforce, or choosing alternative training programs.
Contrary to popular belief, college acceptance rates have increased overall. A study by the American Enterprise Institute shows that the median acceptance rate for bachelor’s-granting institutions rose by 7.6 percentage points compared to a decade ago. Most colleges are easier to get into today, although top-tier universities remain highly selective.
Only 33 U.S. colleges and universities had an acceptance rate under 10% in 2024. These include the Ivy League, Stanford, MIT, and a handful of other elite institutions. While these schools dominate headlines, they represent a very small portion of U.S. higher education.
In 2012, 80% of nonprofit colleges had acceptance rates above 50%. By 2024, that number had increased to 87%. This means the majority of nonprofit institutions admit most applicants, making access to higher education easier than many assume.
Data from the National Association for College Admission Counseling (NACAC) shows that in 2024:
78% of applicants were admitted to public colleges.
70% of applicants were admitted to private colleges.
Both figures are higher than they were a decade ago (68% and 65%, respectively).
By 2024, 62.8% of recent high school graduates enrolled immediately in college (NCES). The remaining 37% either entered the workforce, joined military service, took a gap year, or pursued vocational/technical training. This shift highlights the growing appeal of alternatives to traditional higher education.
The leading reasons include:
Rising tuition costs and student debt worries.
Higher earning potential in skilled trades and certifications.
Flexible, shorter career training options (coding bootcamps, apprenticeships).
Uncertainty about the return on investment of a four-year degree.
Post-pandemic lifestyle changes and mental health concerns.
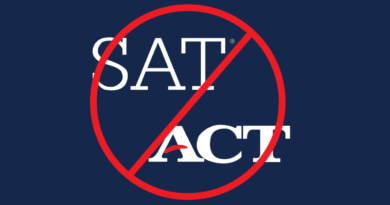
Since 2020, many universities adopted test-optional or test-blind policies. This led to higher application volumes, especially at selective colleges, but did not significantly change acceptance rates for most institutions. Elite schools saw more competition as students without SAT/ACT scores felt more confident applying. However, mid-tier and nonprofit colleges largely maintained or slightly increased acceptance rates.
The NCES projects a continued modest decline in undergraduate enrollment through 2026, before stabilizing. The high school graduate population is expected to peak around 2025–2026, then flatten or decline depending on the region. This demographic “cliff” means many colleges will compete harder for students, likely keeping acceptance rates high but potentially reshaping how institutions operate.